How to Read Your Claude Code Bill: What You're Actually Paying For
80-90% of your Claude Code bill is input tokens, not output. What each line on the Anthropic invoice actually means and where the cost goes.
When your Anthropic bill arrives, the number that jumps out is the total. The number that explains the total is the input token count, and most developers do not look at it until something goes wrong.
Understanding the bill requires understanding what fills it. The total is not a single charge. It is the product of token counts and prices, and the token counts are themselves the product of what got sent to the model on each request. Before you can make decisions about your Claude Code usage, you need to know which part of the bill is actually large.
TL;DR
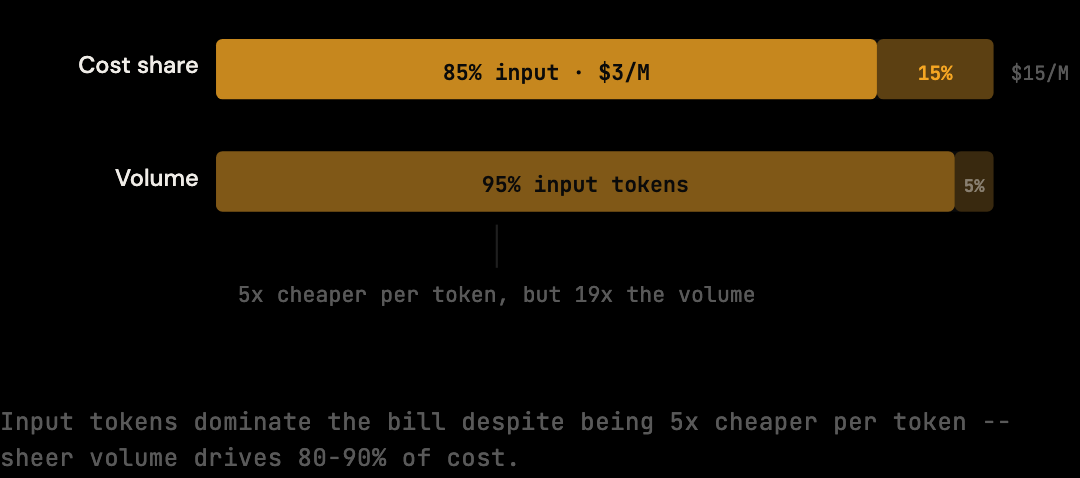
- 80-90% of a Claude Code bill is input tokens, not output. Input volume dominates because every turn resends the full conversation history.
- Output tokens are 5x the per-token rate ($15/M vs $3/M) but Claude generates 500-2,000 tokens per response while receiving 10,000-80,000 tokens of context.
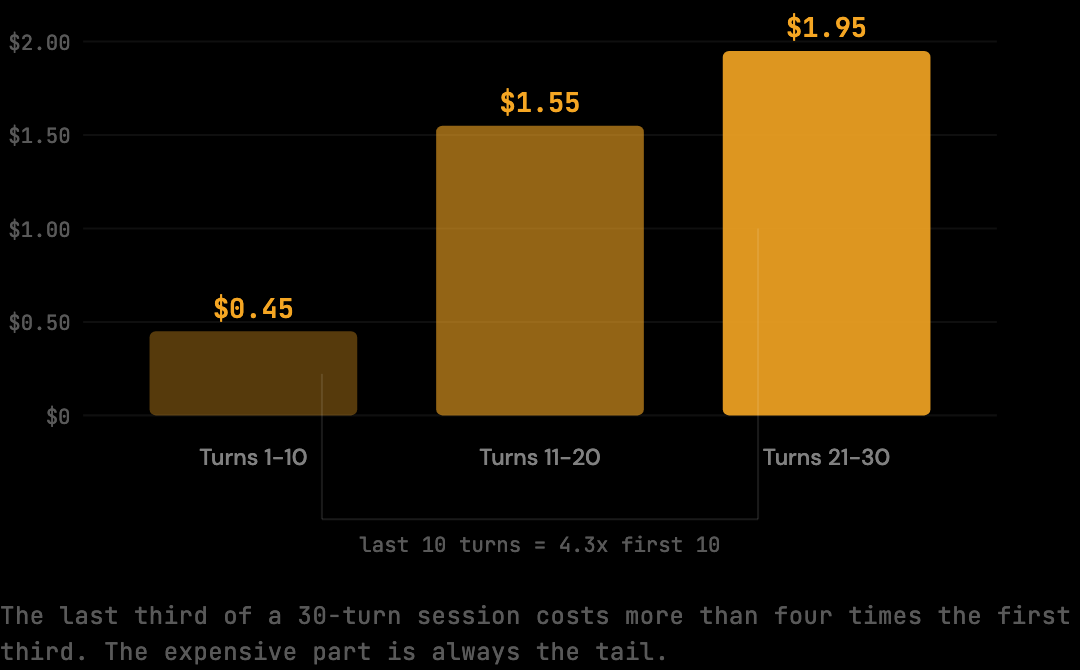
- Late-session turns cost dramatically more than early-session turns. Turns 21-30 typically cost 4x what turns 1-10 cost on the same session.
- The Anthropic dashboard shows totals but not composition. Knowing what fills the input tokens (shell output, file reads, accumulated history) requires proxy-layer instrumentation.
- Starting fresh sessions for distinct tasks is the most effective single mitigation because it cuts the expensive tail of the cost curve entirely.
Input Tokens vs Output Tokens
Anthropic bills input and output tokens separately at different rates. Input tokens are everything sent to the model: messages, prior assistant responses, tool results, system prompt. Output tokens are what Claude generates. For Claude Code coding sessions, 80-90% of the bill is input volume, even though output's per-token rate is 5x higher ($15/M vs $3/M).
The pricing makes this asymmetry appear different at first glance:
Input tokens:  $3.00 per million
Output tokens: $15.00 per million
Output tokens are 5× more expensive per token. That sounds like output should dominate the bill. But in a coding session, Claude generates responses of 500-2,000 tokens while receiving context windows of 10,000-80,000 tokens. The volume difference overwhelms the per-token price difference. By the midpoint of an active session, input token costs are running 5-10x higher than output costs on every turn.
What Counts as an Input Token
Four categories fill the input token count: your message (the smallest piece, typically 200-500 tokens), Claude's previous responses (the surprise — these are resent on every turn), tool results from file reads and shell output (often 5,000+ tokens per result), and the system prompt with Claude Code context (1,000-2,000 tokens on every turn). Each compounds across turns.
Your message to Claude. The question or instruction you type. This is typically 200-500 tokens, often less. It is the smallest component of every input payload.
Claude's previous responses. This is the part that surprises most developers. Every response Claude has generated in the current session is resent as part of the input context on every subsequent turn. A response with code and explanation runs 1,000-3,000 tokens. A 20-turn session might carry 30,000-40,000 tokens of prior Claude responses in the input payload of turn 20, and those same tokens are resent again on turns 21, 22, and 23.
Tool results: file reads, shell output, search results. When Claude reads a file, the contents become a tool result in the context. A 300-line source file is roughly 3,000 tokens. Shell output from a test run can be 500-5,000 tokens depending on the test suite. Every tool result from the current session is carried forward in subsequent inputs.
System prompt and Claude Code context. Claude Code injects a system prompt and context on every request: information about the project, the available tools, operating parameters. This runs 1,000-2,000 tokens and is present on every single turn.
As a session grows, the ratio tilts further toward input. By turn 20, your 200-token message is a rounding error. The context carrying prior responses, tool results, and accumulated history is what determines the cost of that turn.
Why the Bill Grows Mid-Session, Not at the Start
The cost of a Claude Code session is nonlinear. The first 10 turns of a 30-turn session cost roughly $0.45. The last 10 turns cost about $1.95 — more than four times as much. The expensive part of any session is the tail, not the start, because each later turn carries the accumulated weight of everything before.
Here is what the input token distribution looks like across a 30-turn session:
Turns 1-10:  avg 15,000 input tokens/turn → 150,000 total
Turns 11-20: avg 40,000 input tokens/turn → 400,000 total
Turns 21-30: avg 65,000 input tokens/turn → 650,000 total

Full session: ~1,200,000 input tokens × $3.00/M = $3.60
Output on the same session: roughly 60,000 tokens × $15.00/M = $0.90. Total session cost: approximately $4.50.
A session that runs to 30 turns does not cost 3× a 10-turn session; it costs closer to 10× because the context compounds on every turn. This is why starting fresh sessions for distinct tasks reduces costs more effectively than managing individual prompts. A 10-turn session is not just shorter — it cuts off the expensive tail of the cost curve entirely.
What the Anthropic Dashboard Shows
The Anthropic usage dashboard reports model name, input token count, output token count, and request count per day. The numbers are accurate for total volume but say nothing about composition. A high input token count could mean long sessions, heavy shell output, repeated file reads, or all three. The dashboard shows the total; it does not break down what filled it.
To understand the composition — how much of your input token volume is shell output versus file reads versus accumulated conversation history — you need visibility into the requests before they reach Anthropic. That requires instrumenting the proxy layer, where each request can be inspected before forwarding.
For the current per-token rates, the Claude Code API pricing page has a model-by-model breakdown.
Seeing the Composition, Not Just the Total
A proxy layer between Claude Code and Anthropic can log per-request composition: which content blocks are largest, which file reads are duplicated, how much shell output is being carried forward. Tools like The Distillery record raw and optimized token counts per session and break them down by stage (deduplication, shell distillation, tool trimming), revealing what is actually driving the bill rather than the total alone.
npm install -g thedistillery
thedistillery start
After running a few sessions, thedistillery stats shows per-session raw vs optimized token counts for real sessions, not benchmarks, but your actual usage. The breakdown by optimization stage reveals which pattern is most prominent in your workflow.
How to Build a Mental Model of Your Own Bill
The Anthropic dashboard shows totals; the proxy logs show composition. Building a personal mental model of your bill takes about a week of normal usage, after which the patterns specific to your workflow become apparent.
Start by recording the raw and optimized token counts for ten consecutive sessions across different task types: short focused edits, longer refactors, debugging sessions, exploratory reads. The relative reduction percentages reveal which session types contain the most redundancy in your workflow. A short focused edit might show 12% reduction; a long debugging session with repeated tool calls might show 45%.
The next layer is the per-stage breakdown. If shell distillation contributes most of the reduction, your workflow runs heavy on test suites and build commands. If deduplication dominates, you iterate on the same files repeatedly. Tool result trimming dominance means stack traces and directory listings are filling context. Each pattern points to different mitigations: shorter test command output, fewer file rewrites, more specific search queries.
After a week or two, the model becomes predictive. You know roughly what a new session of a given type will cost before it starts, which is the foundation for making sensible decisions about session scoping and restart timing.
What the Bill Tells You About Workflow
A high input-token bill is not just a cost report — it is an indirect description of how Claude Code is being used. Three signals correlate with specific workflow patterns, and recognizing them changes which mitigations actually help.
Signal 1: input-output ratio above 90%. This is the default for any developer using Claude Code as more than a chat assistant. It means agentic work (multi-file edits, autonomous navigation) is dominating the workload. Output token mitigations (shorter responses) will not help meaningfully.
Signal 2: rapid month-over-month input growth without proportional output growth. This indicates session length is increasing while task scope is roughly constant. The likely cause is sessions running longer before being restarted, which is the most expensive pattern because of the compounding context tail.
Signal 3: high session count with low per-session input. This is the cheapest profile — many short focused sessions rather than fewer long ones. Maintaining this profile through deliberate restart discipline is the highest-leverage workflow change a developer can make for cost reduction.
Frequently Asked Questions
Q: Why is my output token count so much lower than input?
Claude generates 500-2,000 tokens per response while receiving context windows of 10,000-80,000 tokens. The volume asymmetry is structural: the model produces a focused response while the input contains the full session history. Even at 5x the per-token rate, output cannot dominate because there is so much less of it.
Q: Does the Anthropic dashboard show me which sessions cost the most?
No. The dashboard shows daily totals by model and request count, not per-session breakdowns. To see which sessions are expensive, the proxy-layer logs are the source of truth — they record per-session token counts on the local machine before forwarding to Anthropic.
Q: Are output tokens worth optimizing if I want a lower bill?
For most Claude Code workflows, no. Output is 10-20% of the bill. Cutting it in half saves 5-10% of the total. Cutting input by the same percentage saves much more because input is the dominant volume. Effort is better spent on input reduction (shorter sessions, context optimization) than output reduction (terser prompts).
Q: Is there a way to get a per-session breakdown directly from Anthropic?
Anthropic's API returns token counts per request in the response, which can be aggregated client-side. The Anthropic dashboard does not natively group by session because Anthropic has no concept of a session — only individual requests. Session-level grouping requires client-side or proxy-side instrumentation.
Q: How do I tell whether a high bill is from many sessions or long sessions?
The proxy logs report request count and average input tokens per request per session. Many short sessions show high request count with low average input tokens. Few long sessions show lower request count with high average input tokens. The cost-per-session distribution reveals which pattern dominates and which mitigation matters most.
The bill is large because input tokens are large, and input tokens are large because every turn carries accumulated context. A proxy-layer optimizer makes the composition visible and reduces the input token volume before it reaches Anthropic.
Try it on your own Claude Code sessions.
The Distillery applies these distillations automatically. Free until it saves you something.