How to Benchmark Your Claude Code Token Savings
Measure your Claude Code token savings in under a minute. The benchmark corpus, the two numbers that matter, and how to read the result.
You don't know what you're paying until you measure it. Most developers find out three weeks in, when the bill surprises them.
The good news is the measurement takes under a minute. Here is how to run it and what the output tells you.
TL;DR
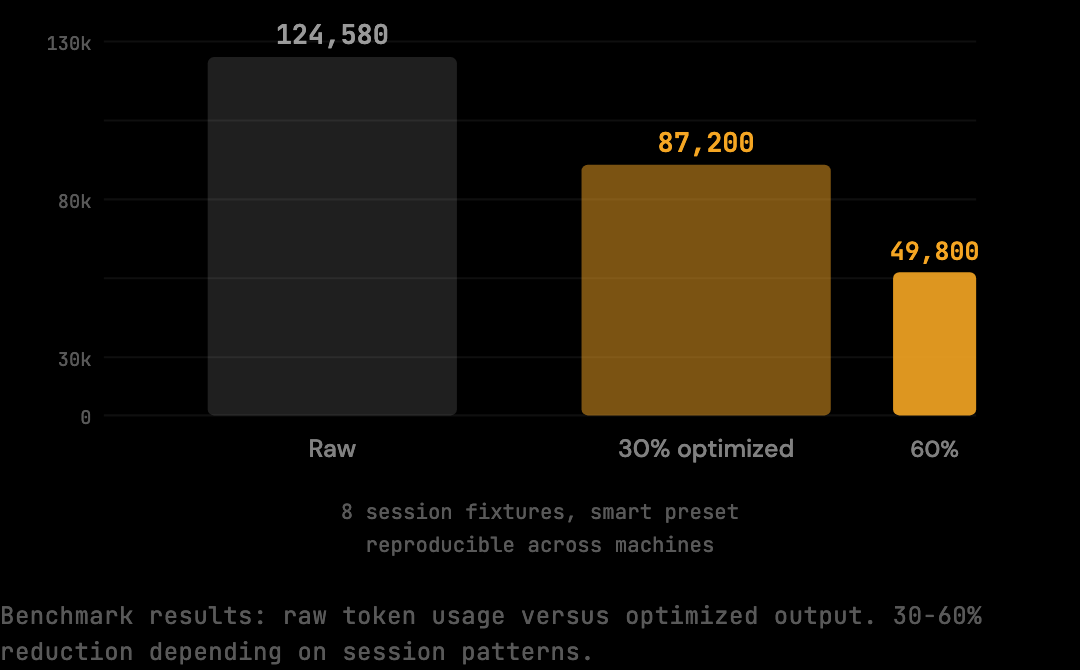
- The benchmark runs a fixed corpus of 8 multi-turn Claude Code session fixtures (124,580 raw tokens) through the optimization pipeline and reports the reduction.
- The reproducible reduction at the smart preset is 20%. The figure is a floor — real sessions with heavy shell output or repeated file reads see 30-60%.
- Two numbers matter:
rawTokens(what Claude Code would have sent) andoptimizedTokens(what reaches Anthropic after the pipeline runs). - Per-session stats from real usage give the workflow-specific number; the benchmark provides a reproducible baseline.
- You cannot act on costs you have not measured. The benchmark gives a baseline in under a minute; per-session stats give the truth after a week of normal use.
What the Benchmark Measures
The benchmark runs The Distillery's optimization pipeline against a corpus of realistic Claude Code session fixtures. The corpus is fixed (8 sessions, 124,580 raw input tokens) and reproducible across machines. The output is two numbers: raw token count (what would have been sent without optimization) and optimized token count (what reaches Anthropic after the pipeline runs). The difference is the reduction.
The fixtures (scripts/benchmark-fixtures.ts) represent actual coding session patterns: multi-turn conversations with tool calls, file reads, shell output, and accumulated context. Because the corpus is fixed and reproducible, the result is a benchmark rather than an estimate.
This is a floor measurement — the minimum reduction on a fixed, reproducible corpus at the smart preset. Real sessions vary depending on what they contain. Sessions with heavy build output or repeated file reads give the optimization pipeline more to work with, which is why real-world reductions often run higher than the benchmark number.
Running the Benchmark
The command is one line: npx tsx scripts/benchmark.ts. No configuration is required, no API keys are needed, and no network calls are made. The script uses bundled fixtures and runs the pipeline at the default smart preset, completing in a few seconds. The result is JSON that can be parsed or copied directly.
npx tsx scripts/benchmark.tsThe full expected output:
{
  "reductionPercent": 20,
  "rawTokens": 124580,
  "optimizedTokens": 99664,
  "model": "claude-sonnet-4-5",
  "preset": "smart",
  "fixtures": 8,
  "script": "scripts/benchmark.ts",
  "corpus": "scripts/benchmark-fixtures.ts"
}
Run this after global install. npx tsx scripts/benchmark.ts executes against the benchmark fixtures in the installed package.
If you want to inspect the fixtures directly, they are at scripts/benchmark-fixtures.ts within the package.
Reading the Output
Each field has a specific meaning. reductionPercent is the headline figure (20% on the standard corpus). rawTokens is the unmodified context payload across the 8 fixtures (124,580 tokens). optimizedTokens is what reaches Anthropic after distillation (99,664 tokens). fixtures is the number of sessions in the corpus. preset is the optimization preset used (smart by default).
Each field in the output has a specific meaning.
reductionPercent: The headline number.
20 means 20% fewer tokens were forwarded to Anthropic on this corpus compared to what Claude Code would have sent without optimization.
This is the reduction at the smart preset on the fixed benchmark corpus.
rawTokens: What Claude Code would have sent without optimization.
124,580 tokens across 8 session fixtures.
This is the unmodified context payload: full shell output, all file reads including duplicates, complete tool results.
optimizedTokens: What actually reaches Anthropic after the pipeline runs.
99,664 tokens.
This is the payload after shell distillation, deduplication, and context trimming have been applied.
fixtures: 8 session fixtures in the benchmark corpus.
Each fixture represents a distinct session pattern: different task types, different tool usage patterns, different levels of shell output and file read frequency.
preset: "smart", the default preset, which applies the core optimizations (shell distillation, deduplication, tool result trimming) without deep distillation that could affect model behavior on sensitive context.
The dollar translation: the difference, 24,916 tokens, costs $0.07 at current input rates ($3.00 per million). Across 20 sessions per week at that rate, that is $1.40 per week, or roughly $72 per year for a developer running one session per day. The number grows with session length and shell output volume. Sessions that run 40-60 turns with heavy test suite output see proportionally larger reductions because the optimization has more redundant content to work with.
What the Benchmark Floor Does Not Tell You
The benchmark figure is a floor on a representative corpus, not a forecast for any specific workflow. Real-world sessions see 30-60% cost reduction depending on session patterns — sessions with heavy build output, repeated file reads, or 40+ turn agentic patterns achieve the upper end of that range. Sessions that are tightly scoped with mostly conversational turns reduce closer to the 20% benchmark floor.
Sessions with heavy build output give the shell distiller more to work with: verbose test runners, build systems with per-file output, long stack traces. Sessions with repeated file reads give the deduplication stage more to remove. Sessions that run 40+ turns give the context trimming stage more accumulated redundancy to address. The benchmark floor is 20%; real-world sessions with these characteristics see the 30-60% range depending on session patterns.
The benchmark tells you what the pipeline produces on a reproducible baseline. Your own session stats tell you what it produces on your actual usage. After running a few real sessions through the proxy:
thedistillery statsThis command reads the session log from ~/.distillery and reports per-session raw vs optimized token counts for sessions you have actually run.
Nothing is sent externally. The stats are stored locally.
If your real-session reduction is higher than 20%, your sessions contain more redundant content than the benchmark corpus.
If it is lower, your sessions are already lean and you are seeing accurate benchmark-level performance.
What a Good vs Bad Reduction Percentage Looks Like
A 20% reduction on real sessions is the expected floor — it matches the benchmark corpus and means the optimization pipeline is running correctly on standard session content. A reduction between 30-50% on real sessions indicates a workflow with significant shell output, repeated file reads, or long agentic tasks; this is normal and expected for committed Claude Code users. A reduction above 50% typically means the sessions involve very verbose tool output (large test suites, build logs with per-file entries, long stack traces) where the shell distiller has a lot to compress. If your real-session reduction is below 15%, check two things: first, whether DISTILLERY_BYPASS is set and causing some sessions to pass through unoptimized, which would pull the average down; second, whether your sessions are unusually short (under 10 turns), because short sessions have less accumulated redundancy for the pipeline to target and will naturally produce lower percentage reductions. A low number on a short session is not a failure — it means the session did not contain enough repeated content to reduce significantly.
Getting the Baseline for Your Own Sessions
The benchmark is a proxy for the average. Your stats are the truth for your sessions.
Tools like The Distillery record per-session raw and optimized token counts to a local SQLite database. After a few days of normal usage, the per-session breakdown reflects the real workflow: the task types being run, the file sizes in the project, the build output the test suite produces. The benchmark gives a baseline in under a minute; the per-session stats give the workflow-specific number after a week of normal use.
npm install -g thedistillery
thedistillery start
After those two commands, every Claude Code request routes through the local proxy.
The proxy logs raw and optimized token counts for each session.
After a few days of normal usage, thedistillery stats gives you a per-session breakdown that reflects your actual workflow: the task types you run, the file sizes in your projects, the build output your test suite produces.
If your reduction is higher than 20%, your sessions have more redundant content, common for projects with heavy test suites, large schema files, or frequent shell commands. If it is lower, your sessions are already lean and the benchmark number is an accurate floor.
How to Adapt the Benchmark to Your Workflow
The default benchmark corpus is representative of average Claude Code usage but may not match a specific developer's workflow. Adapting the benchmark to a personal corpus produces a more accurate reduction figure for that workflow.
The fixtures live in scripts/benchmark-fixtures.ts as TypeScript exports of message arrays. Adding a new fixture is a matter of capturing a representative session and adding the messages array to the file. The benchmark script picks up additional exports automatically. A developer who runs primarily React component refactors might add fixtures from those sessions; a developer running primarily Python data pipelines would add their own.
The reduction figure on a personalized corpus is more meaningful than the default. The default 20% averages across many session types; a personalized corpus reflects the specific patterns of one workflow. For developers committing to long-term use, this customization produces a more honest internal figure for cost reduction modeling.
Comparing Benchmark Figures Across Models
The default benchmark runs at claude-sonnet-4-5. The same pipeline can be run against fixtures targeting other models (Haiku, Opus) by changing the model field in the benchmark configuration. The reduction percentage is similar across models because the pipeline operates on the messages array independently of which model will process it. What changes is the dollar value of the reduction.
For Haiku, the per-token cost is lower so the dollar saving per million tokens is smaller, but the percentage reduction is roughly the same. For Opus (when applicable), the per-token cost is higher and the dollar saving per million tokens is larger. Cross-model comparison is most useful for teams that mix model usage across different tasks and want to estimate total saving across the workload.
Frequently Asked Questions
Q: Does running the benchmark cost any API credits?
No. The benchmark runs entirely against local fixtures with no network calls and no API keys required. The token counts are computed using the chars/4 estimation method, the same method used internally by the optimization pipeline. There is no Anthropic API contact.
Q: How long does the benchmark take?
A few seconds on a modern laptop. The pipeline runs deterministically on 8 fixtures totaling 124,580 raw tokens. The result is a JSON object that the user can parse or copy directly.
Q: Why doesn't the benchmark report a higher reduction?
Because the corpus represents average Claude Code usage, not best-case scenarios. Heavy agentic sessions with repeated tool calls reduce by 30-60% on the same pipeline; the corpus deliberately includes mixed session types to produce a representative floor figure. The 20% is reproducible because the corpus is fixed.
Q: Can I run the benchmark on the same machine that runs my Claude Code?
Yes. The benchmark is a separate command from the proxy itself. Both can coexist. Running the benchmark while the proxy is also running has no interaction; they are independent operations.
Q: How do I share the benchmark result with my team?
The JSON output is copy-pasteable. For visual sharing, the benchmark page renders the methodology and numbers in a format suitable for screenshots or links. Both representations point to the same underlying figure.
You cannot act on costs you have not measured. The benchmark gives you a baseline in under a minute; your session stats give you the real number after a few days of use. The benchmark page shows the methodology and numbers in a more visual format if you want to share the results with a team. Start with the benchmark, then install The Distillery and measure your own sessions.
Try it on your own Claude Code sessions.
The Distillery applies these distillations automatically. Free until it saves you something.